Skip to content

How to Use Quant Reporting

Published:

YouTube Video

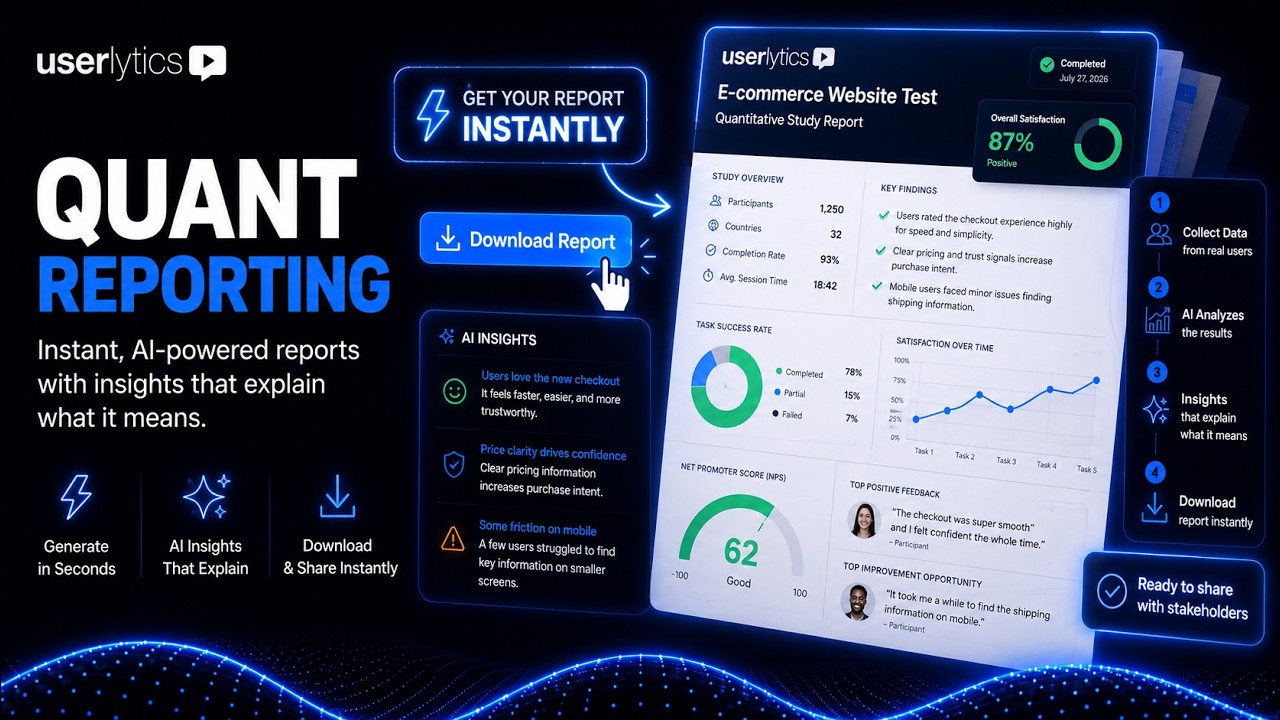
Quant Reporting turns your study’s quantitative data into a polished, presentation-ready DOC report in one click. Instead of exporting raw CSVs and rebuilding charts by hand, you get a fully formatted document with every chart paired with an AI-generated summary of what the data means — ready to forward to stakeholders.

Report generation happens asynchronously in the background, so you’re free to keep working, close the tab, or move to another study while it’s created.

Note: Quant Reporting is available once your study is marked complete. The AI-generated summaries included in the report are currently in BETA.

How to Generate Your Report

1. Open a completed study from your dashboard.

2. In the left sidebar, click Metrics.

3. In the top-right corner, click Generate Report.
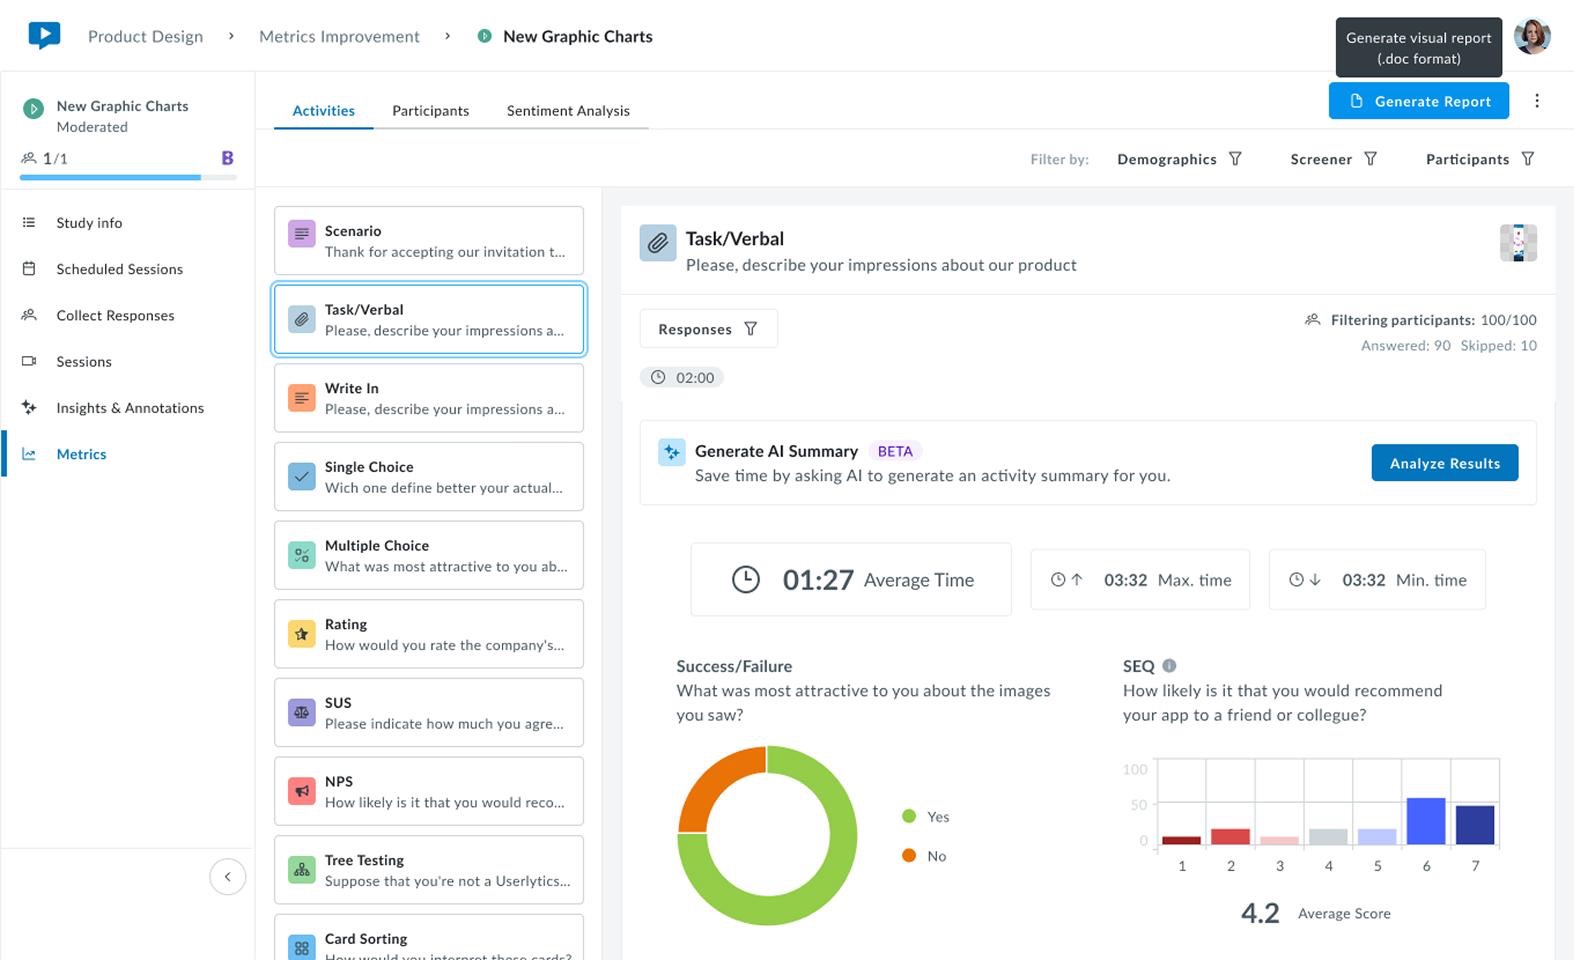
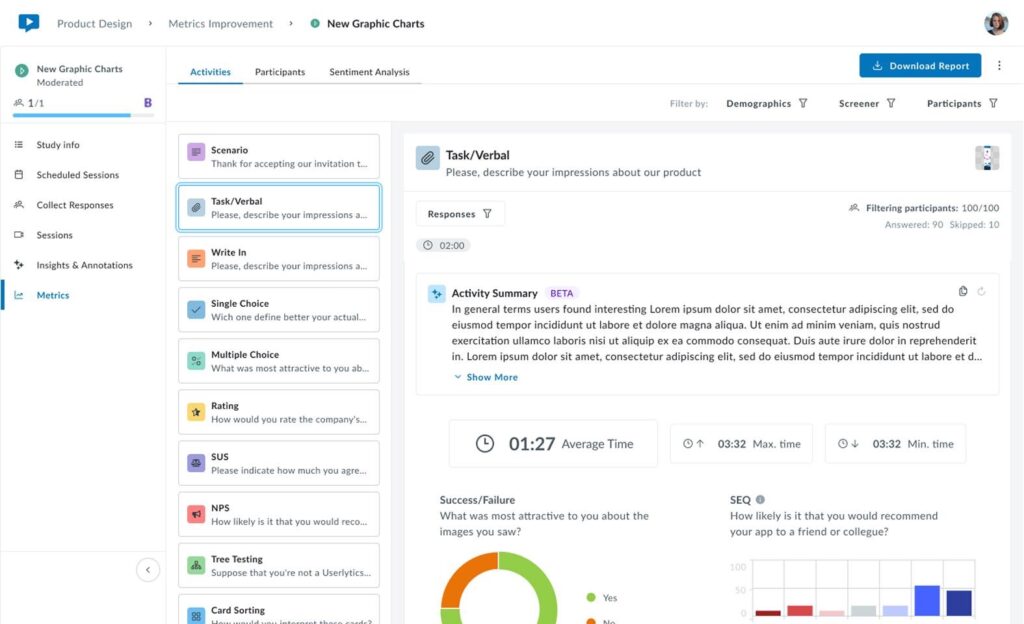
4. The button changes to Generating Report while Userlytics compiles your data and AI insights in the background. This can take a few minutes — feel free to navigate away and keep working.
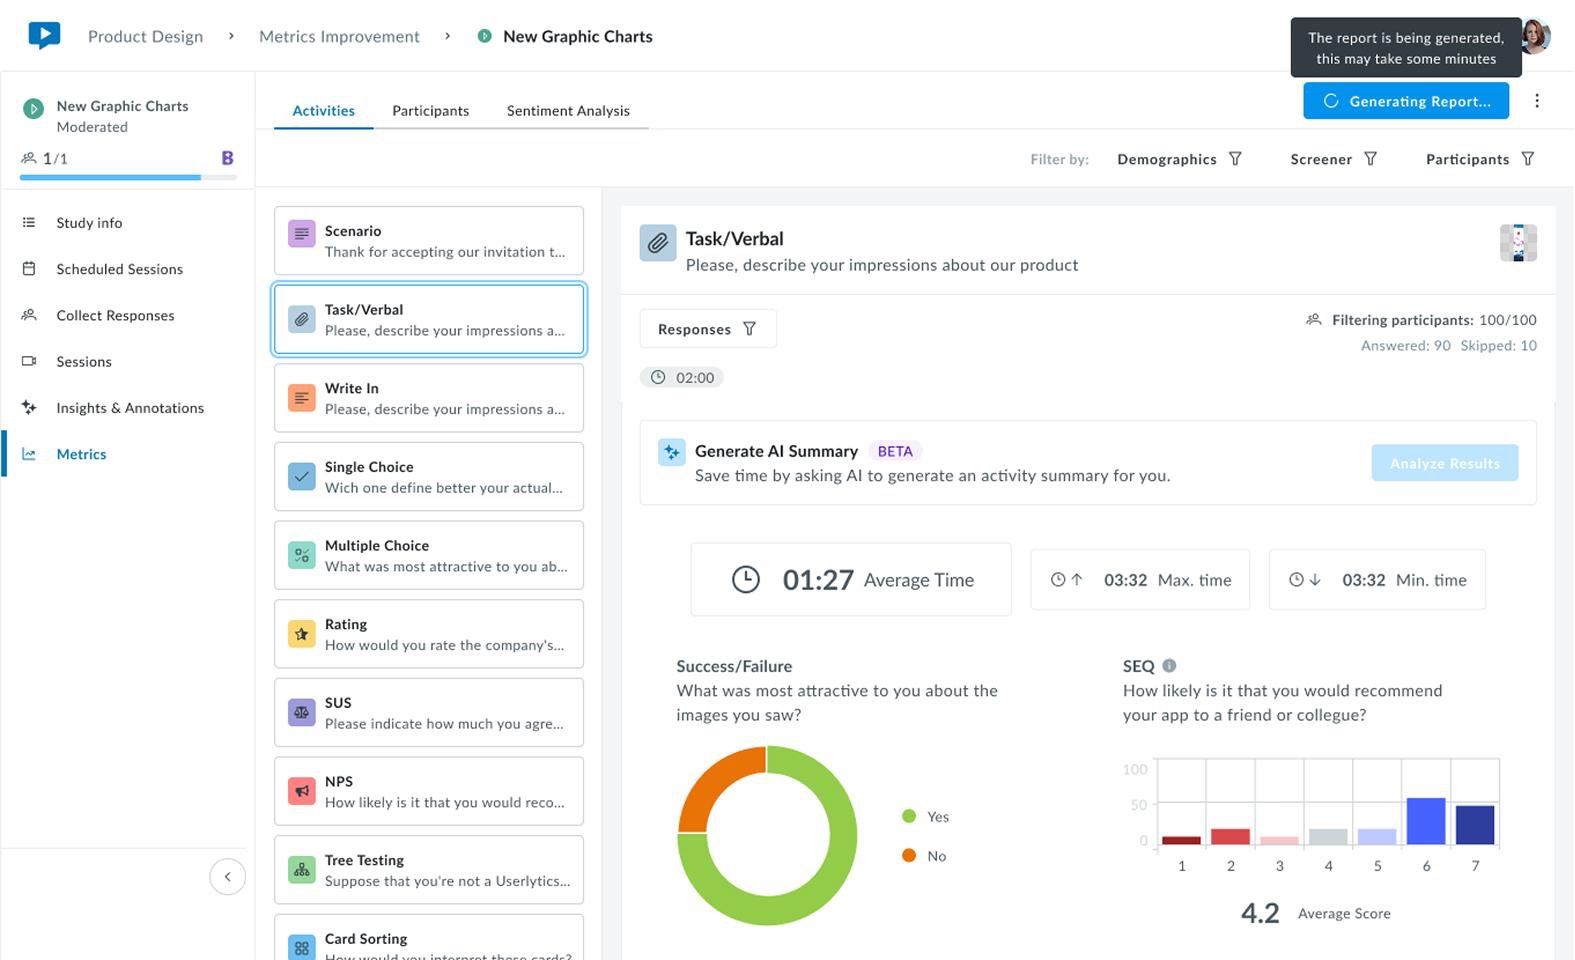
5. Once it’s ready, the button changes to Download Report. Click it to download your DOC.
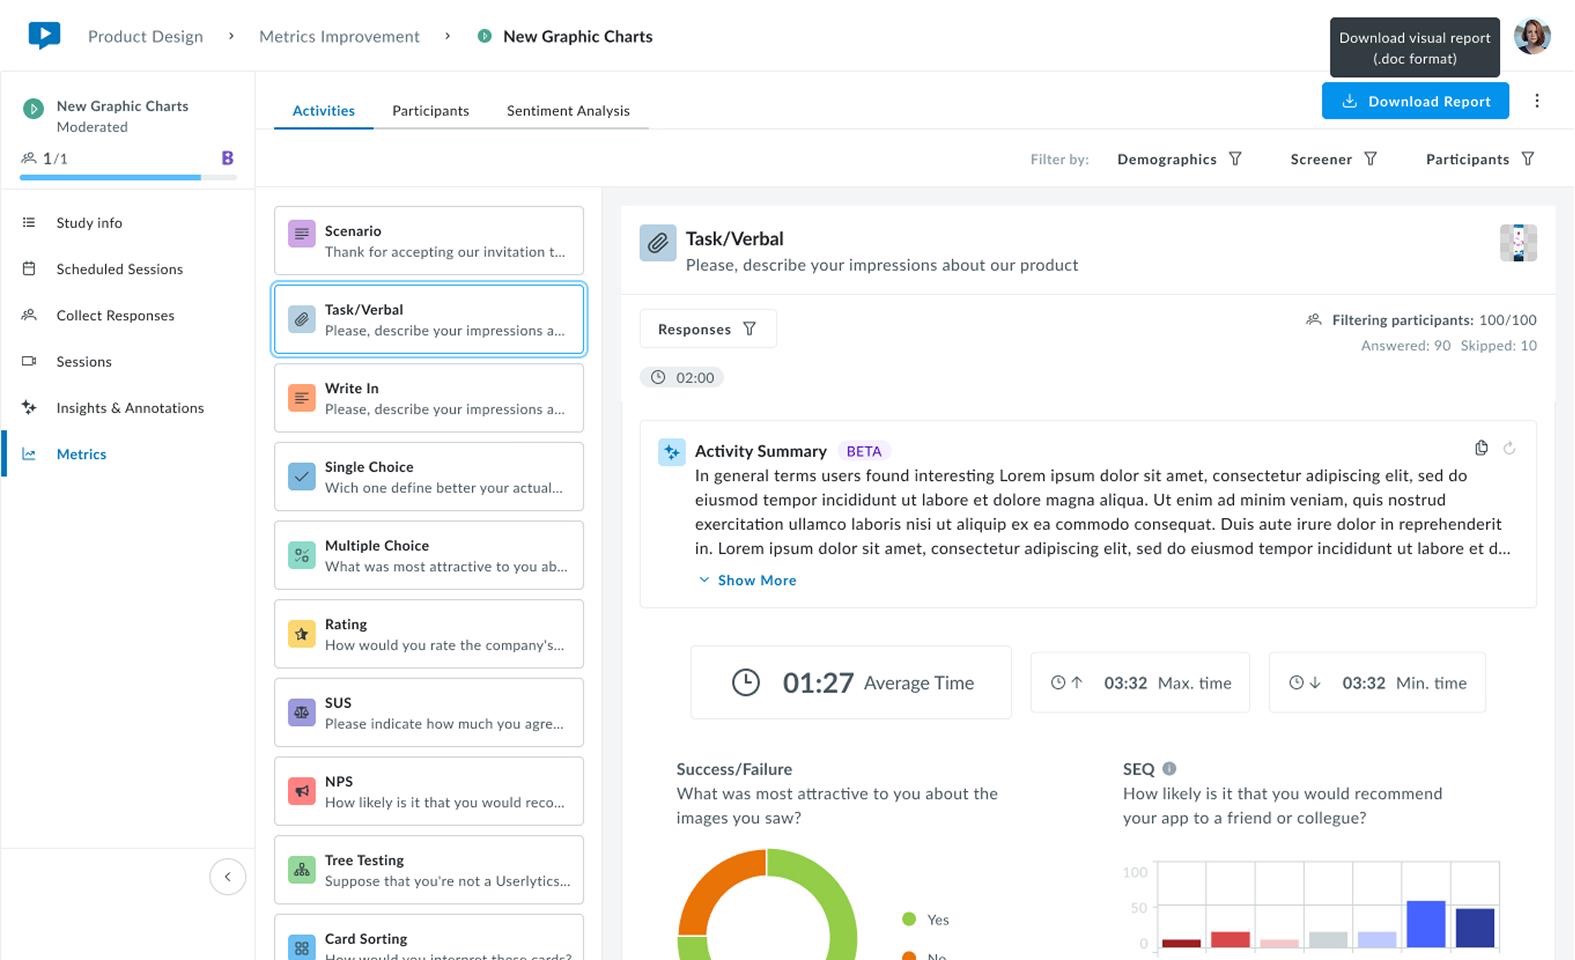
You’ll also see a notification in your study’s Study Pulse timeline once the report is ready to download, so you don’t need to keep the Metrics tab open while you wait.

What’s Included in the Report

Each supported activity appears with its visual chart alongside an AI-generated Activity Summary — the same plain-language interpretation available from the Generate AI Summary banner above each activity’s chart in Metrics. Rather than just showing what happened, the summary tells you what it means: patterns, standout results, and areas worth a closer look.

FAQs

Once your study is marked complete, the Generate Report button becomes available from the Metrics tab.
No. The AI summaries included in the exported report are generated automatically as part of building the report and don't require you to click Analyze Results on each activity beforehand.
Generation time depends on study size, but it typically completes within a few minutes. You'll see a “Generating Report” state on the button while it works, and can return to the Metrics tab anytime to check progress or download once it's ready.
Yes. Report generation happens asynchronously on our servers, so you can continue working elsewhere in your account or close the tab entirely.
A DOC file, formatted and paginated automatically so it's ready to share or present without additional editing.
Quant Reporting compiles data from your study's Metrics tab. For details on which activity types include AI-generated summaries, see the Generate AI Summary banner within each activity in Metrics.

Didn’t find what you were searching for?

Related posts:

Clients
June 4, 2026

How to Translate Session Transcripts with AI Session Translations

Run studies in any language and analyze them in yours. AI Transcript Translations lets you translate session transcripts into a diverse selection of internat...
Clients
May 29, 2026

How to Access AI Chart Summaries

Learn how to use AI Chart Summaries in Userlytics — an AI-powered feature that interprets your Metrics data instantly
Clients
March 23, 2026

Getting Started with AI Annotations

AI Annotations automatically identify key moments from your user sessions, getting you from raw data to insights faster.
Clients
January 27, 2026

How to use AI Insights to Automate Your Research Analysis

Learn how to use Userlytics AI Insights to turn hours of video analysis into instant intelligence directly within your study dashboard.

Ready to Elevate Your UX Game?

×Returning client?
Contact us