

Picture a participant asked to find last month’s invoice in a redesigned account area. She looks at the screen for a few seconds, then clicks her profile picture instead of the Billing tab. Whether that click is her habit or the most common answer in your study decides whether the new labels ship as they are.
A first click test answers that question on a single screenshot, before anyone writes code. The first click testing templates below cover eight screens enterprise teams change most often. Each one gives you two task scenarios, the target area to mark, a follow-up question, and a rule for reading the result.
TL;DR
- Pick the template that matches the screen you are about to change.
- Write tasks as goals in the participant’s words, never with the label on the screen.
- Mark the correct target area and agree on a success threshold before launch.
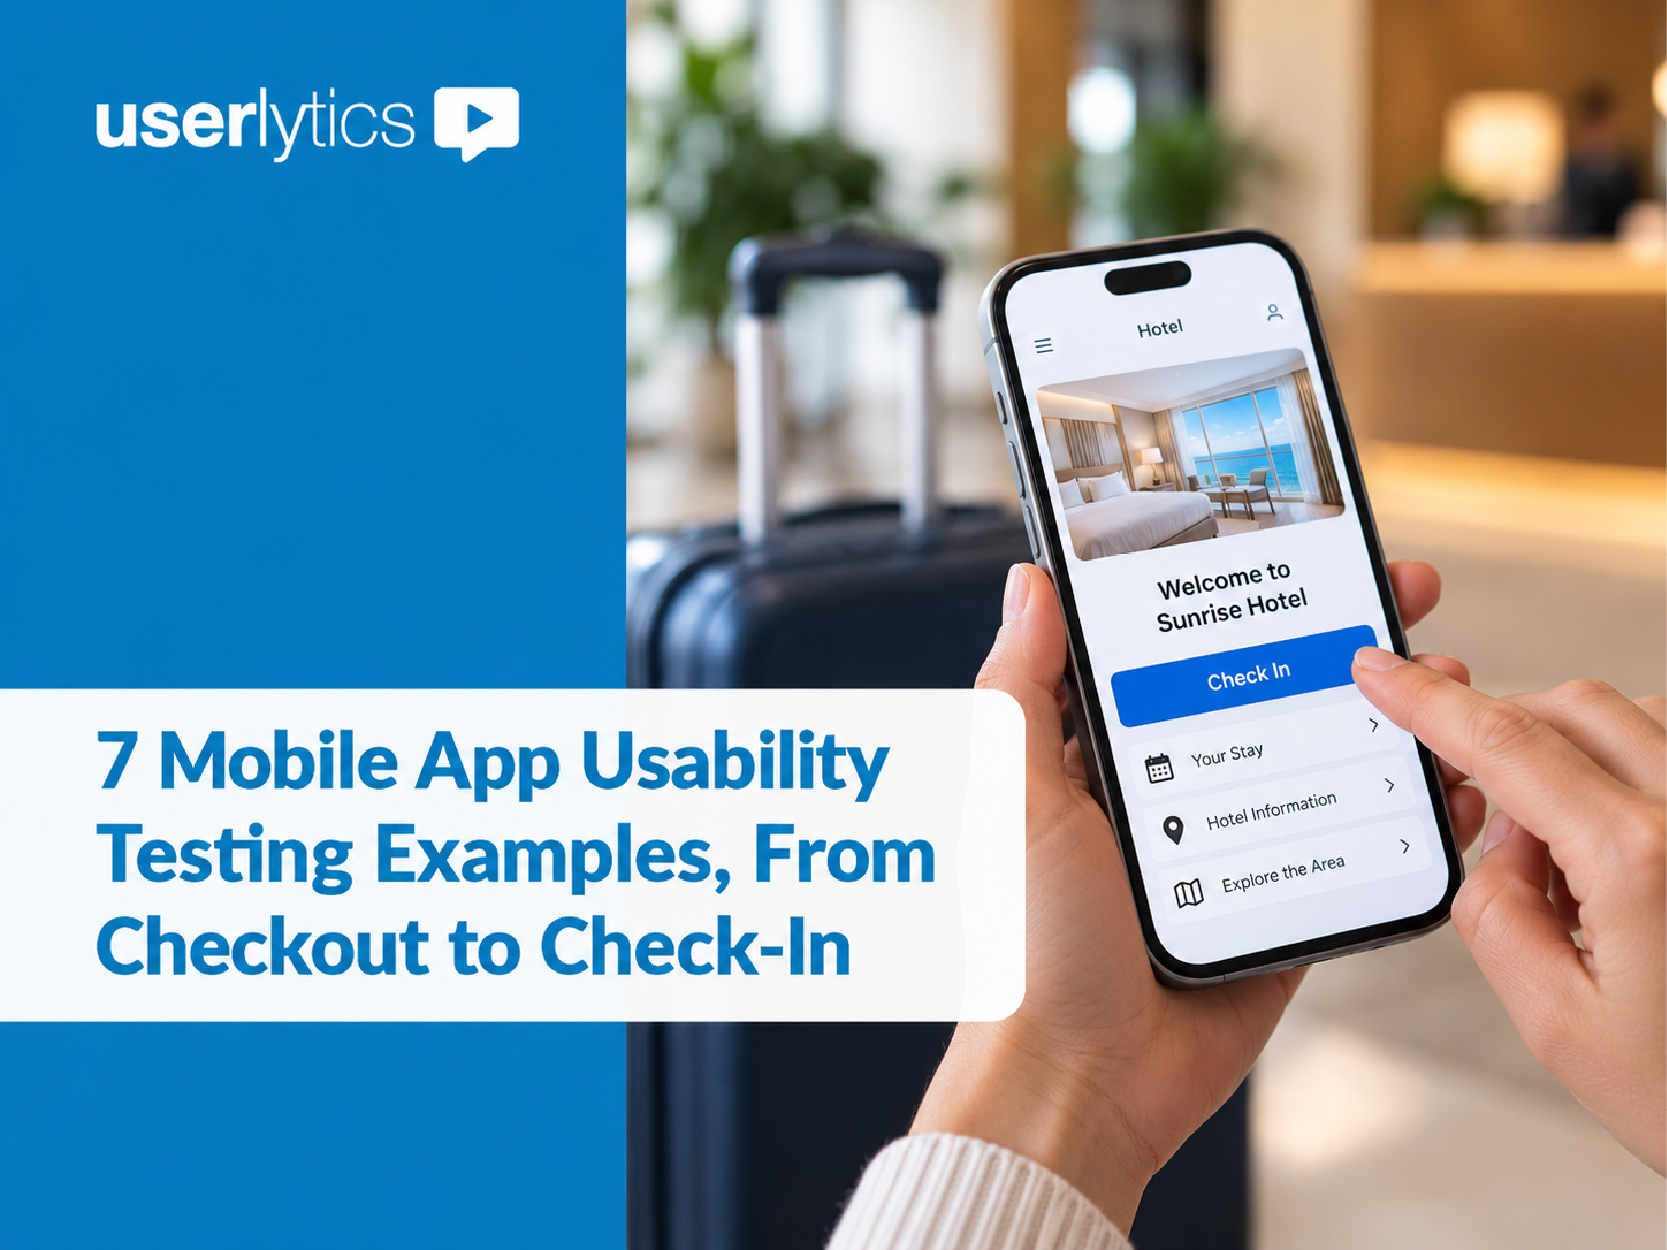
- Read where the wrong clicks land as closely as the success count.
- Use first click testing for the starting point, then test the full flow separately.
Compare the 8 First Click Testing Templates at a Glance
Every template is an illustrative model study: the screens, tasks, and thresholds are examples to adapt and report no results from a real Userlytics study.
| # | Template | Screen to upload | Question it answers |
| 1 | Homepage navigation | Desktop homepage with the header | Do top-level labels send people to the right section? |
| 2 | Plan selection | Pricing page and plan table | Can buyers find the plan that fits their team? |
| 3 | Ecommerce product page | Product detail page | Can shoppers find fit and delivery information? |
| 4 | Account settings | Logged-in account overview | Can customers handle billing and email changes alone? |
| 5 | Dashboard feature | Default dashboard view | Can people find a feature the team says is underused? |
| 6 | Mobile app home screen | Phone screenshot at device size | Which tab or icon gets the first tap? |
| 7 | Help center | Help center homepage | Do people choose self-service or contact when they should? |
| 8 | Redesign comparison | Version A and version B | Which layout gets more correct first clicks? |
1. Homepage Navigation Template
Use this template when your team is renaming or reordering the top-level menu and wants evidence before the build starts.
- Screen to upload: A full-width screenshot of the desktop homepage, header included. If you also serve a mobile layout, run it as a separate study.
- Task 1: “Your team is comparing vendors and wants to see which companies already work with this one. Where would you click first?”
- Task 2: “Your legal team asked whether this product meets your company’s data protection rules. Where would you click first to check?”
- Target area: The menu item that leads to customer stories for Task 1 and the security or trust page for Task 2. If a homepage module links to the same page, mark it as a second correct area and report both.
- Follow-up question: A 7-point rating, “How confident are you that this click would get you what you need?”
- Read the result: If most wrong clicks gather on one menu item, that label is pulling people away from the target. Check the underlying structure with a tree test template before you rename anything, since the page may sit in the wrong section even when its name is clear.
2. Plan Selection Template for Pricing Pages
Use this template when the pricing page shows three or more plans and sales hears from prospects who chose the wrong one.
- Screen to upload: The pricing page as a visitor first sees it. If the comparison table sits below the fold, add it as a second screenshot for its own task.
- Task 1: “Your company has 40 people who all need to sign in with their work accounts, and you want one named contact for support. Where would you click first to start with the plan that covers this?”
- Task 2: “Your team expects to add 10 people next quarter. Where would you click first to find out how that changes the bill?”
- Target area: The call-to-action button or column of the plan that fits Task 1, and the billing details or plan FAQ for Task 2.
- Follow-up question: A write-in question, “Which plan do you think fits this team, and why?”
- Read the result: A correct click paired with the wrong plan in the write-in tells you the layout works but the plan differences are unclear. That points to a content fix in the plan descriptions while the layout stays as it is.
3. Product Page Template for Ecommerce Teams
Use this template when returns or support contacts mention fit or delivery surprises, or when a product page redesign is in progress.
- Screen to upload: A product detail page, desktop and mobile as separate studies. Participants complete realistic shopping tasks on the image; nobody places an order.
- Task 1: “You are between two sizes for this jacket and want to check which one matches your measurements. Where would you click first?”
- Task 2: “You need the jacket before a trip on Friday. Where would you click first to see whether it can arrive in time?”
- Target area: The size guide link for Task 1 and the delivery estimate or shipping details for Task 2.
- Follow-up question: A 7-point ease rating for each task.
- Read the result: If a large share of Task 1 clicks land on the size selector itself, shoppers expect the fit help to live there. Moving the size guide link next to the selector is a reasonable next design to test. For the full shopping journey, our guide to ecommerce usability testing covers the later stages.
4. Account Settings Template for Self-Service Tasks
Use this template when support tickets keep arriving for changes customers could make themselves.
- Screen to upload: The logged-in account overview with dummy names, addresses, and invoice numbers. Never use a real customer’s data in the image.
- Task 1: “Your company moved offices, and invoices should now go to the new address. Where would you click first?”
- Task 2: “You receive more product update emails than you want. Where would you click first to get fewer of them?”
- Target area: The billing section for Task 1 and the notification or email preferences link for Task 2.
- Follow-up question: A write-in question, “Where did you expect this option to be?”
- Read the result: When clicks split between Profile and Billing, participants hold two reasonable homes for the same setting. A visible cross-link from the second location often resolves it, and you can confirm the fix with the same template.
Want a UX researcher to plan and run these studies with your team? Userlytics UX Consultants design the study, recruit participants, analyze the sessions, and present the findings to your stakeholders. Explore UX Consulting
5. Dashboard Feature Discoverability Template
Use this template when a feature has low adoption, and the team cannot agree whether people miss it or simply do not need it.
- Screen to upload: The dashboard in its default state for a typical account, with sample data.
- Task 1: “Your manager wants last quarter’s numbers in a spreadsheet for her own report. Where would you click first?”
- Task 2: “You want the dashboard to show only your region every time you sign in. Where would you click first?”
- Target area: The export control for Task 1 and the filter or saved-view control for Task 2.
- Follow-up question: A single-choice question, “Have you used this option in the product before?” with yes, no, and not sure.
- Read the result: Split the success count by that answer. If experienced customers click the right control and new ones do not, the placement may be fine, and the gap sits in onboarding. If both groups miss it, the control needs a clearer label or position.
6. Mobile App Home Screen Template
Use this template when a redesign changes the bottom tab bar, the home screen icons or the menu.
- Screen to upload: A phone screenshot at the device’s real proportions. On the Userlytics platform, first click testing works on mobile, so participants tap on their own phones.
- Task 1: “You ordered something yesterday and want to see when it will arrive. Where would you tap first?”
- Task 2: “A friend sent you a discount code. Where would you tap first to save it for your next order?”
- Target area: The orders tab for Task 1 and the account, wallet, or offers area for Task 2, depending on where your app keeps codes.
- Follow-up question: A 7-point ease rating.
- Read the result: A screenshot cannot open a menu. If the target sits behind a menu icon, the correct first tap is the icon itself, and the opened menu needs its own screenshot and task. Taps split between two icons usually mean the icons need text labels, which you can test with the same tasks.
7. Help Center and Support Contact Template
Use this template when contact volume is high for questions the help center already answers, or when customers say they cannot reach a person.
- Screen to upload: The help center homepage.
- Task 1: “The sign-in code your account sends by text message is not arriving. Where would you click first to solve this?”
- Task 2: “You have read the help articles and still need to speak with someone about a billing error. Where would you click first?”
- Target area: Both the search field and the sign-in category count as correct for Task 1, reported separately. The contact option is the target for Task 2.
- Follow-up question: A write-in question, “What do you expect to happen after this click?”
- Read the result: If Task 2 clicks go to search, the contact option is either hard to see or intentionally quiet. Make that a deliberate decision with your support lead rather than an accident of layout.
8. Redesign Comparison Template for Two Versions
Use this template when two candidate layouts are on the table, and stakeholders are split.
- Screens to upload: Version A and version B of the same page, exported at the same size and with the same content.
- Tasks: The same two task scenarios on both versions, worded identically.
- Study design: Run the versions with two separate groups recruited with the same screener, so nobody sees both. If one group must see both versions, alternate which version comes first, since participants learn the page on the first pass. The Userlytics A/B testing template shows a side-by-side setup you can adapt.
- Follow-up question: A 7-point ease rating after each task.
- Read the result: Compare correct first clicks as exact counts per group, then the time to first click. A gap of one or two participants in groups of 20 is not a decision; a clear gap plus a wrong-door cluster in one version is.
Adapt Any of These First Click Testing Templates With One Planning Sheet
Fill in one sheet per screen before you open the study builder, and share it with the stakeholder who will act on the result.
| Field | What to write | Example |
| Business question | The decision this study informs | Keep or rename the Resources menu |
| Screen and version | File name and date of the design | Homepage v3, October export |
| Participants | Who they are and how you screen them | IT buyers at companies with 500+ staff |
| Device | Desktop, mobile, or both as separate studies | Desktop only |
| Task scenario | The goal, in the participant’s words | “Check whether this product meets your data rules” |
| Target area | Every correct element, marked on a copy of the screenshot | Trust link in footer and Security in menu |
| Follow-up question | One rating or write-in per task | 7-point confidence rating |
| Success threshold | The count that means ship, agreed before launch | 16 of 20 participants or more |
Three task-writing rules from Nielsen Norman Group’s guidance on task scenarios keep the data honest:
- Give participants a realistic reason to act, close to why your customers arrive.
- Ask them to act (“Where would you click first?”) instead of describing what they would do.
- Leave out the words printed on the screen, unless the term is the standard name for the thing. A task that says “Sign up for the newsletter” next to a “Sign up for newsletter” button measures word matching.
Set Up a First Click Test on the Userlytics Platform
The setup takes one activity per task, and the steps below follow the Userlytics Help Center setup guide.
- Open the Activities tab in the study builder and choose First Click from the left menu.
- Add the task question and upload the screenshot or image. The first click testing activity works with screenshots of websites, prototypes, and mobile apps. Userlytics limits the activity to static images so the heatmap stays accurate, which means live pages are not supported.
- Make the question mandatory, so every participant answers before moving on. If a screen shows sensitive information, you can turn off screen recording for that step.
- Add your follow-up as its own activity, using a Rating, Write-In Response, or Single/Multiple Choice question.
- Save the finished activity to your Saved Activities library by clicking on the heart button, so colleagues reuse the same task wording in the next round.
- Recruit from the Userlytics panel of 2M+ participants in 150+ countries, or invite your own customers through BYOU (Bring Your Own Users). Both recruitment routes support the activity, in moderated and unmoderated studies alike.
Results appear on the study’s Metrics dashboard. You can switch between a heatmap and a click map of individual clicks, and a sortable table below lists each participant’s time to first click.
Score the Results Without Overreading the First Click
A first click result is a strong early signal, and it reads best next to the core usability metrics you already track.
First click success. Count the participants whose first click lands in the target area and report the count, for example, “17 of 20 participants,” with the percentage beside it if stakeholders prefer one. The reason teams care comes from research by Bailey, Wolfson, Nall, and Koyani, published in 2009. Across their tests on several websites, participants who made a correct first click had an 87% chance of completing the scenario, against 46% after an incorrect one.
The limit to name before a stakeholder does. Those figures come from first clicks on working websites, and the study did not test images. When MeasuringU compared the two in 2023, 130 participants clicked in similar places on images and live homepages, with an average gap of about 6% across target regions. The gap grew where hover menus and other dynamic elements behaved differently, and the authors described their result as likely a best case. Treat a screenshot result as solid evidence for a static layout, and confirm dynamic navigation in a full session.
Time to first click. Use the median from the per-participant table, since a few slow participants pull an average up. Compare it across tasks or versions; a slow but correct click points to a target people find only after searching.
Wrong-door clusters. When most wrong clicks gather on one element, you have a wrong-door cluster: a label or visual that promises what the target delivers. Scattered wrong clicks suggest the target is hard to see. A cluster tells you exactly which element to rename, move, or test next.
Participants who stand out. If one participant clicks the same corner on every task, review the session recording before excluding the data. Exclude only on clear evidence that the person did not engage or follow instructions, and note the reason in your readout.
Sample size. Jakob Nielsen at Nielsen Norman Group recommends 20 participants for quantitative studies (2006), and suggests testing several designs with 20 each over one design with a much larger group. For template 8, that means 20 per version.
Avoid These Mistakes in First Click Testing
Most first click studies that mislead a team fail in planning, so each fix below happens before launch.
| Mistake | What it does to the data | Fix |
| Task repeats the label on the screen | Measures word matching instead of understanding | Describe the goal in the participant’s words |
| Target area chosen after seeing the clicks | Moves the goalposts toward whatever happened | Mark targets and the threshold before launch |
| Hover or dropdown menu tested on a flat image | Hides options participants would see live | Give the opened menu its own screenshot and task |
| Real customer data in the screenshot | Creates a privacy risk in every session | Use dummy data and disable recording if needed |
| Only the success count gets reported | Misses the element competing with the target | Review the click map for wrong-door clusters |
| Result presented as proof the whole flow works | Claims more than one click can show | Follow up with a test of the full task |
Pair First Click Testing With the Right UX Research Method
First click testing evaluates whether participants recognize where to start, so it sits between methods that answer neighboring questions.
- Before it: a tree test checks the website information architecture as text only, so you know the structure holds before visual design comes into play.
- Alongside it: an X-second test assesses initial impressions and recall. Run the Userlytics 5 second test template on the same screen when you also need to know what people remember.
- After it: remote usability testing on a working build or prototype shows whether the right first click leads to a finished task. For the deeper why, a moderated session lets a researcher guide the participant, observe each step, and ask follow-up questions; our comparison of moderated and unmoderated testing helps you choose.
Put These First Click Testing Templates to Work This Sprint
A screenshot and two well-written tasks can settle a navigation debate in days instead of a design review cycle. Choose whichever of these first click testing templates matches the screen your team changes next, and fill in the planning sheet before you open the study builder.
On Monday, write the two task scenarios in your customers’ words, mark every correct target area on a copy of the screenshot, and agree on the success threshold with the stakeholder who owns the decision. Launch an unmoderated study with 20 participants, then read the wrong-door clusters before the success count.
See where your participants click first on the screen you are about to change. Book a free demo
FAQs
These answers cover the setup questions teams raise most often when they adapt a first click test template.