Welcome to the future of rapid research analysis! AI Annotations is an intelligent system designed to instantly identify key moments from your user sessions, offering detailed traceability of individual observations and manual notes.

Here’s how to get started with AI annotations inside the Userlytics platform.
First, navigate to a study within the Uselytics platform.
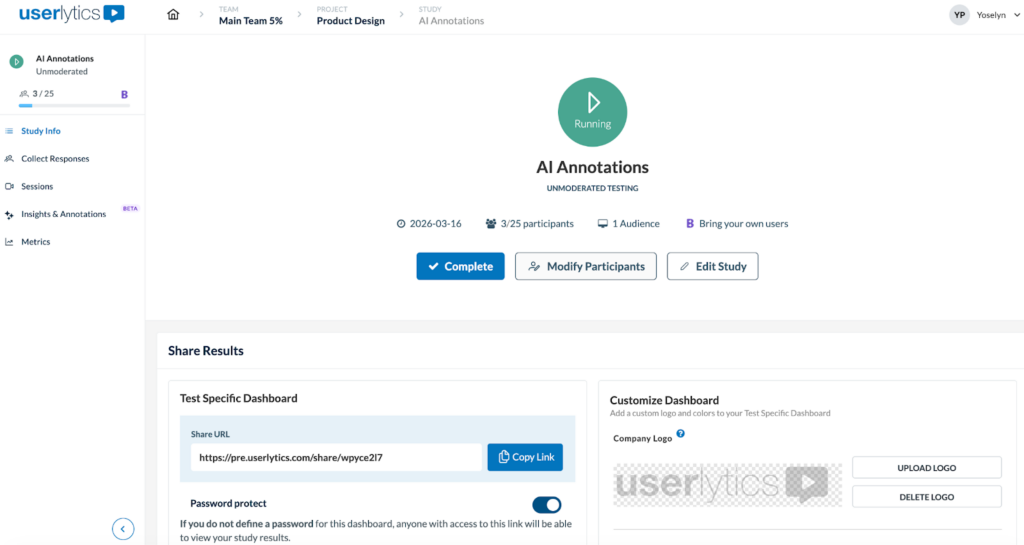
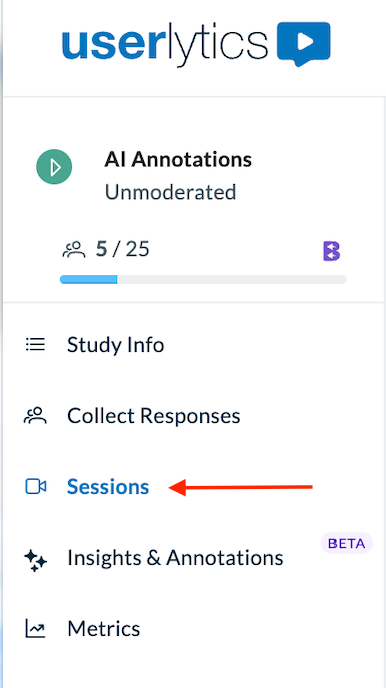
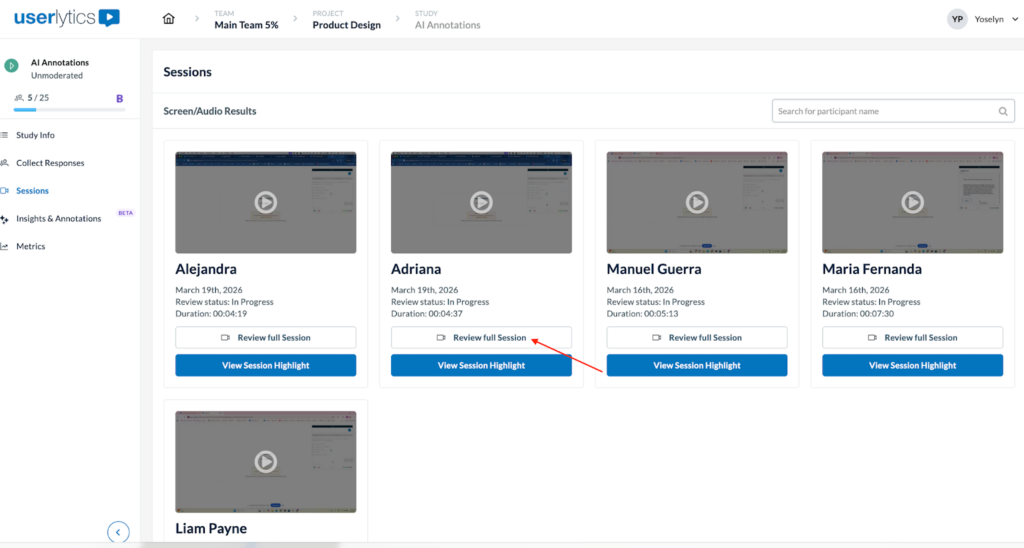
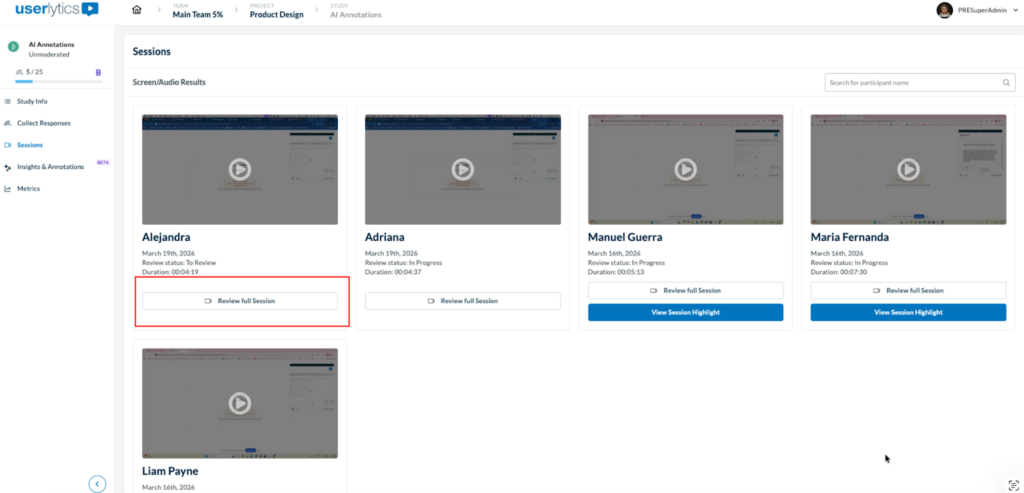
Once there, navigate to the Sessions page by clicking on “Sessions” on the left-hand side panel.
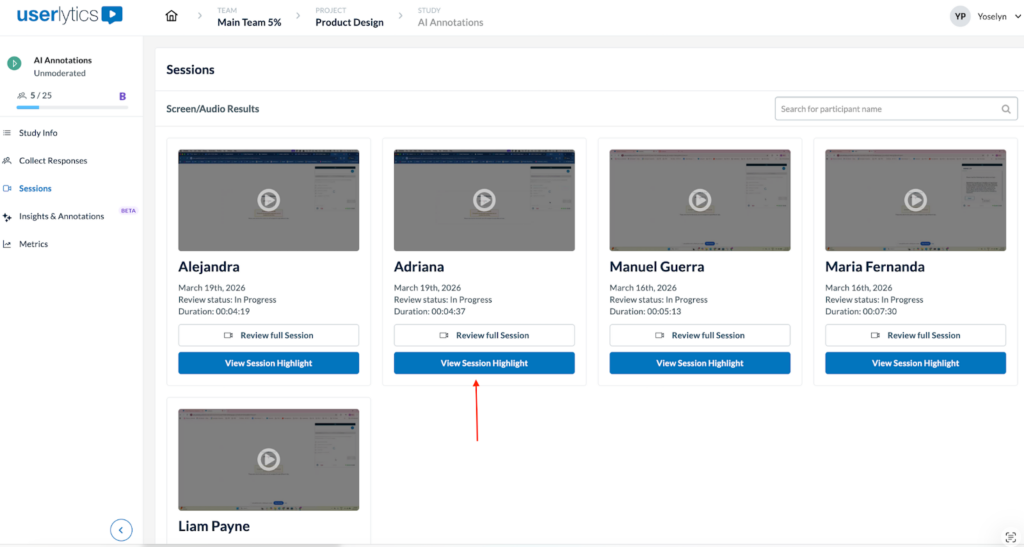
Under the Sessions view, you will notice a new option on each participant card: “View Session Highlight.”
Once clicked, the system instantly processes the session on your behalf, scanning user interactions, speech, and navigation to automatically identify and label key moments, sentiment, and activities, based on the transcription.
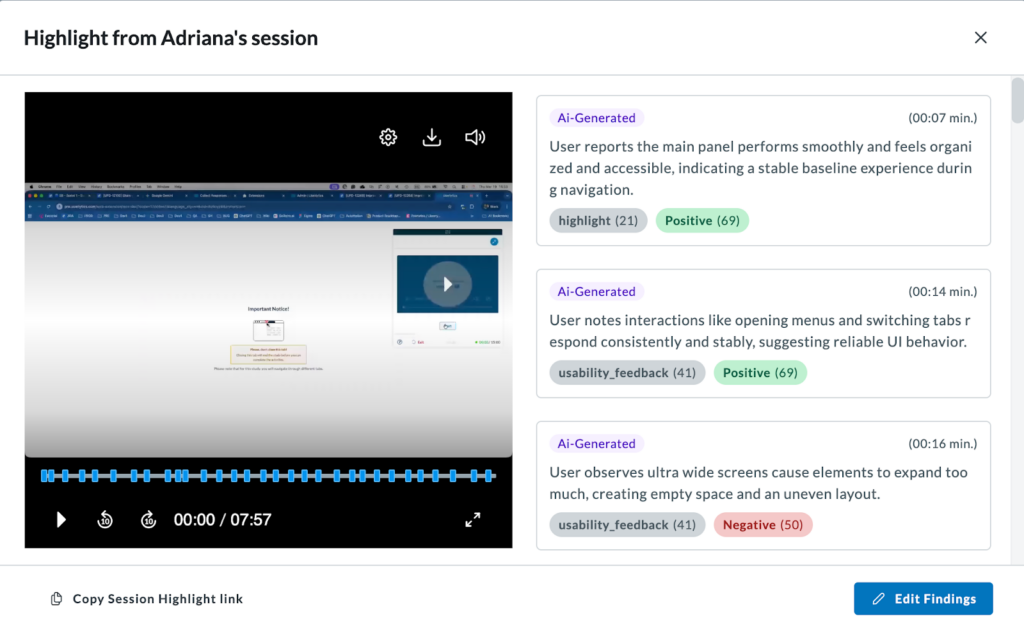
The system then generates a “Reel” (a stitched video compilation of all these identified key moments) so you don’t have to watch the entire session. To the right of the video you will see a list of all AI-generated annotations.
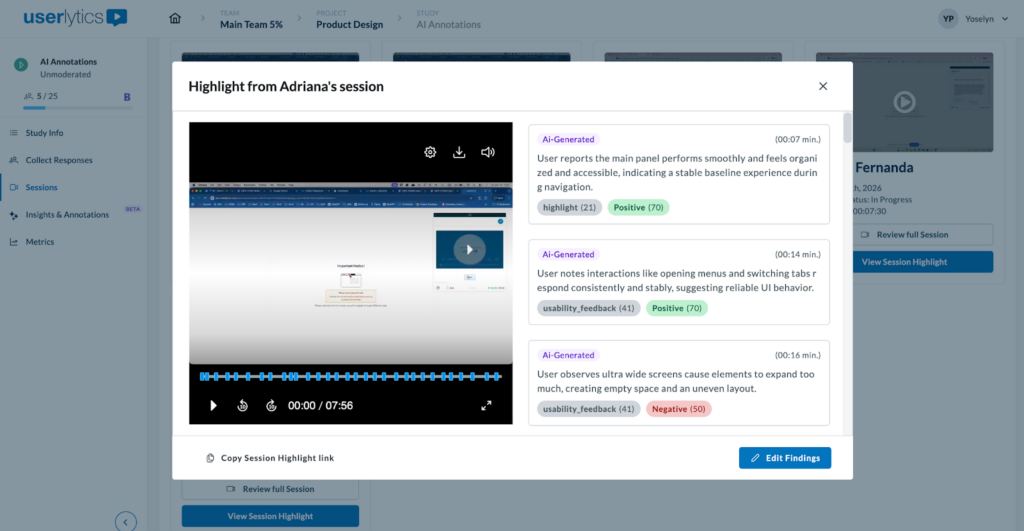
Click on “Edit Findings” to access the standard Session view or copy the Session Highlight link.
You can also access AI-generated annotations by reviewing the full session right away. Under the Sessions view, click on the “Review full session” button.
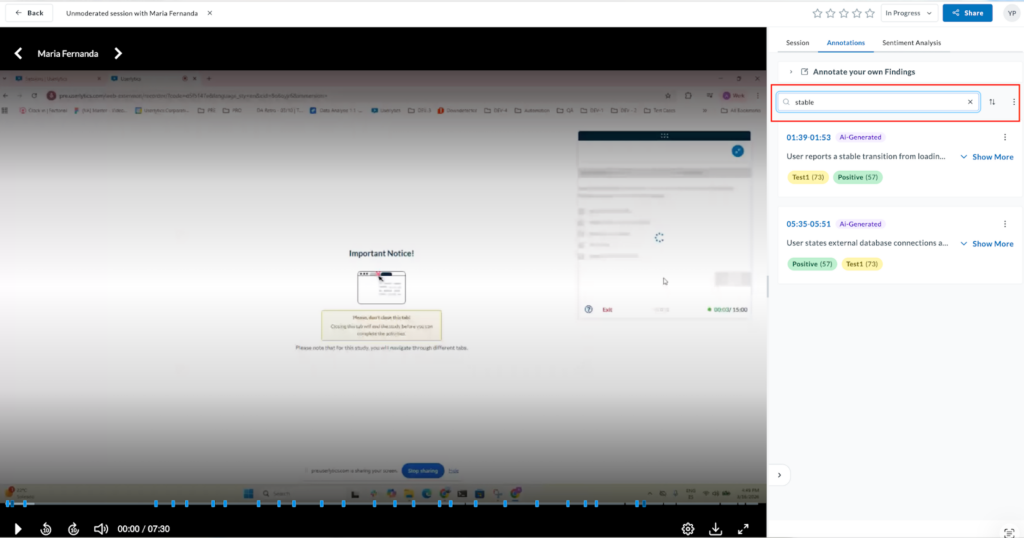
Once there, look for the Annotations tab where all the annotations will appear in chronological order.
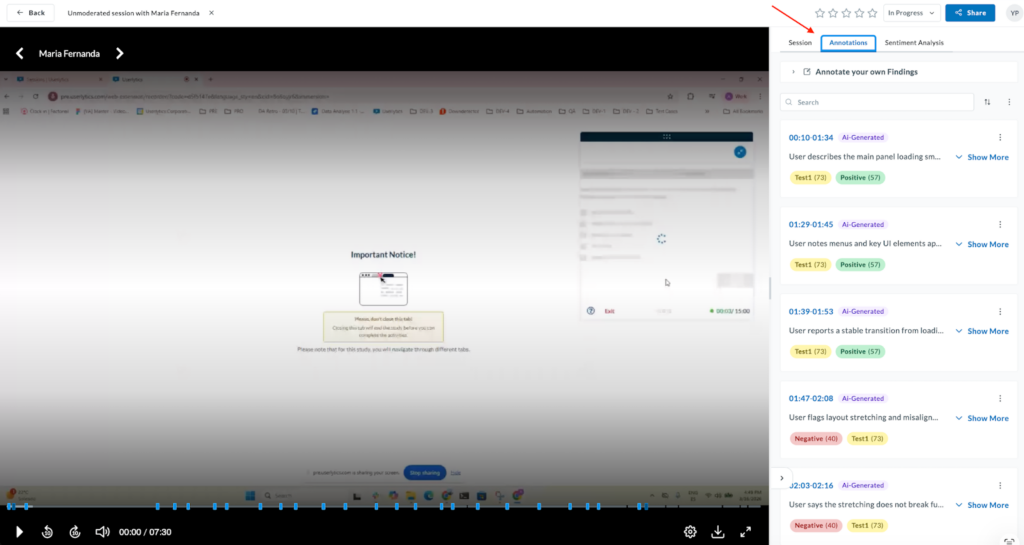
Annotations will appear organized chronologically with precise timestamps, a summary, tags, and clearly labeled as “AI-Generated” to distinguish them from manual notes.
You can use the “Search” bar to quickly find specific keywords within the automated findings, as per usual.
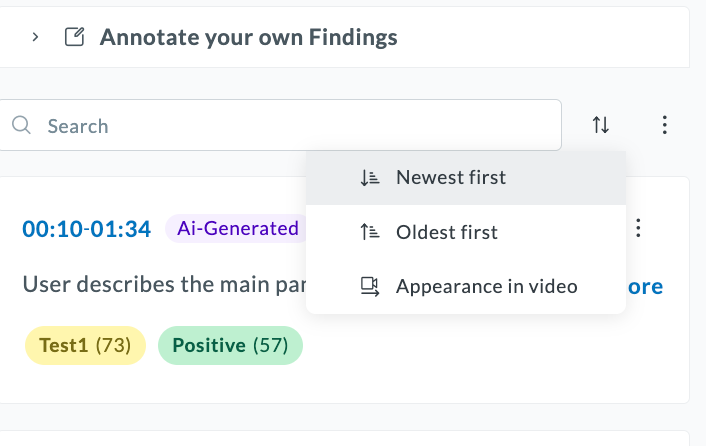
Or sort annotations by clicking on the two-arrow menu item as displayed below.
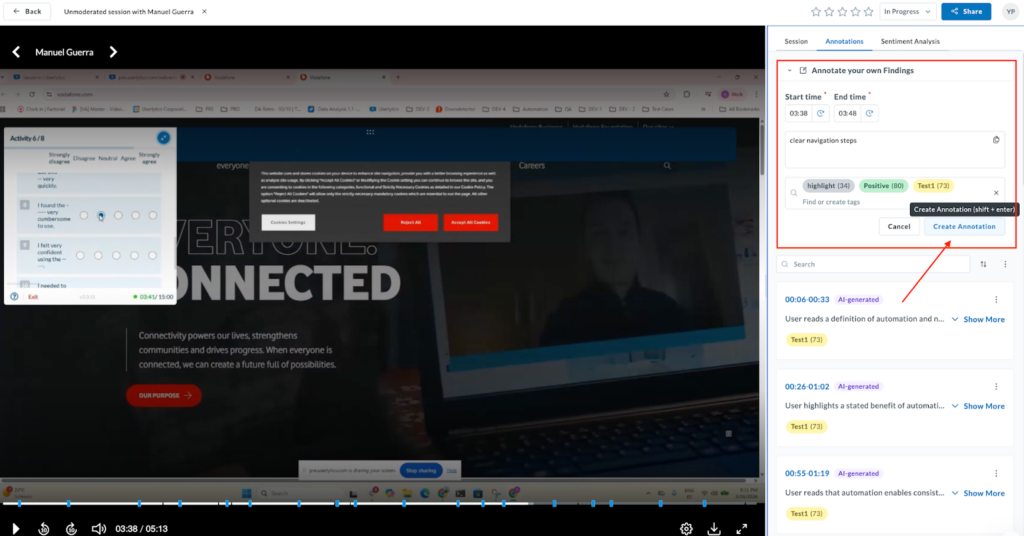
You can continue using the existing manual method at any time. Simply click on ‘Annotate your own findings’ and input the information into the required fields to add your own observations.
Enter the timestamps, summary, and tags as you normally would, and hit ‘Create Annotation‘ to add it to the timeline.
Clicking the three-dot vertical icon on any annotation card opens a list of management options.
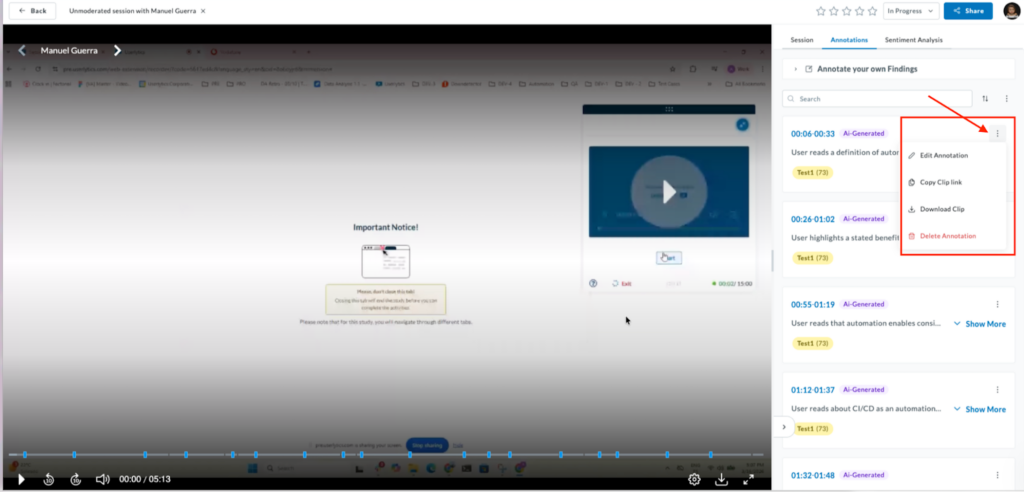
- The Edit Annotation option allows you to modify the timestamps or adjust the specific tags assigned by the AI to better fit your research goals.
- Copy Clip link: Instantly copies the URL for that specific video segment to share with stakeholders.
- Download Clip: Allows you to save the specific annotated segment directly to your device.
- The Delete Annotation option lets you remove any AI (or manual) annotation that is not relevant to your study.
Clips are now generated automatically, hence why the “copy clip link” and “download clip” options will always be enabled for you.
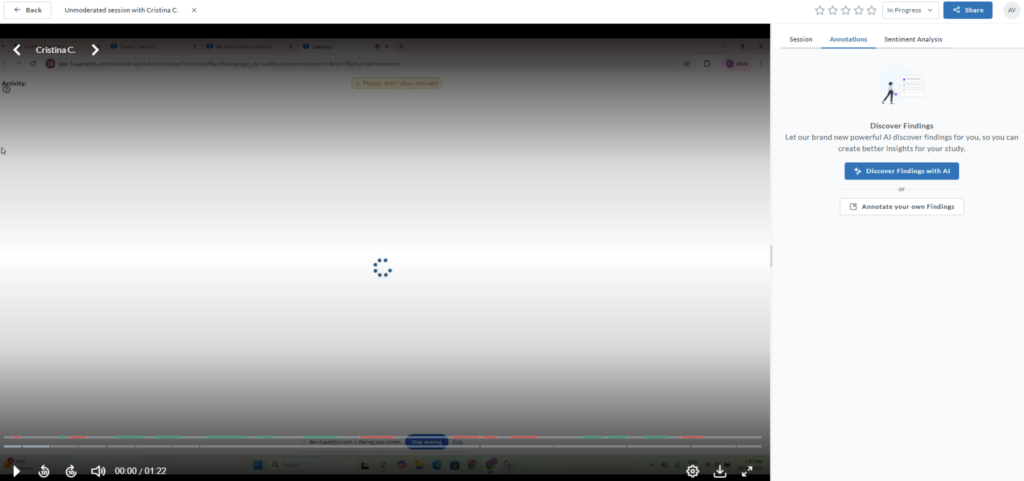
NOTE: If you enter a session directly without having generated a highlight first, you haven’t missed out. You can either continue to create annotations manually as always, or alternatively, you can now simply ask the AI to create them for you by clicking the “Discover Findings with AI” call-to-action button.
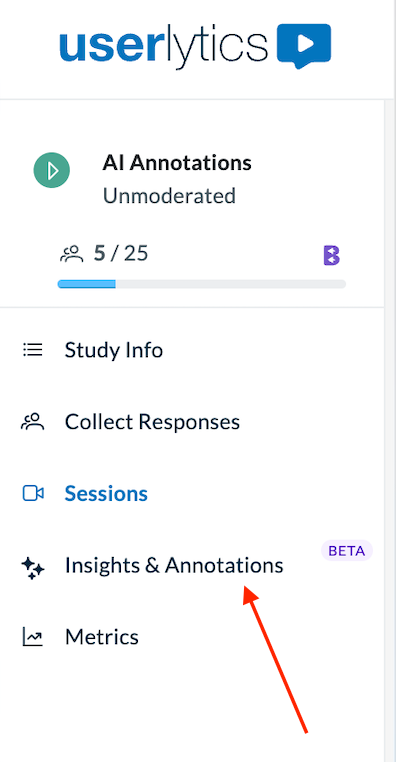
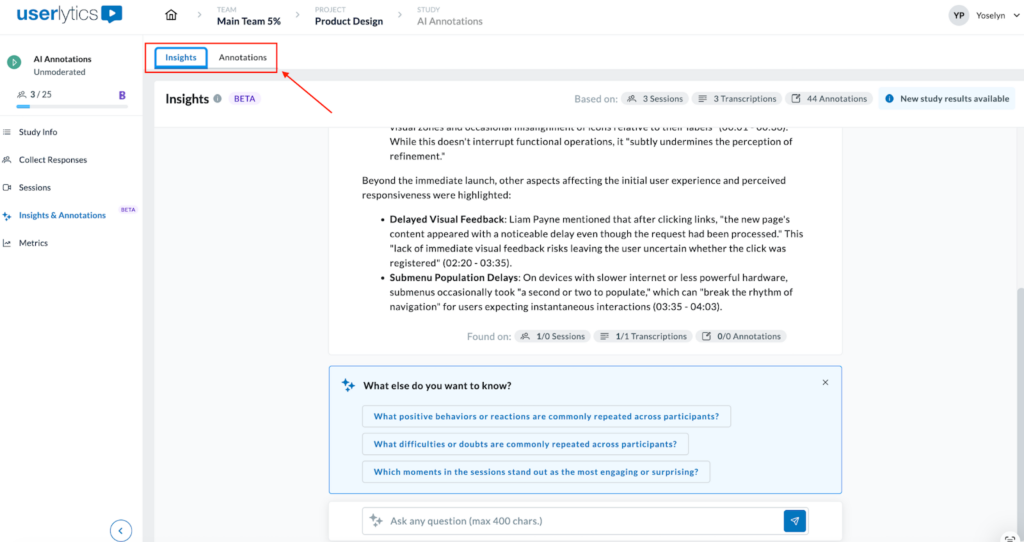
You can also find AI-generated annotations under the “Insights and Annotations tab” on the left-hand menu.
You’ll first land on the Insights tab. At the top, the header displays contextual information about the study data used to generate insights and annotations.
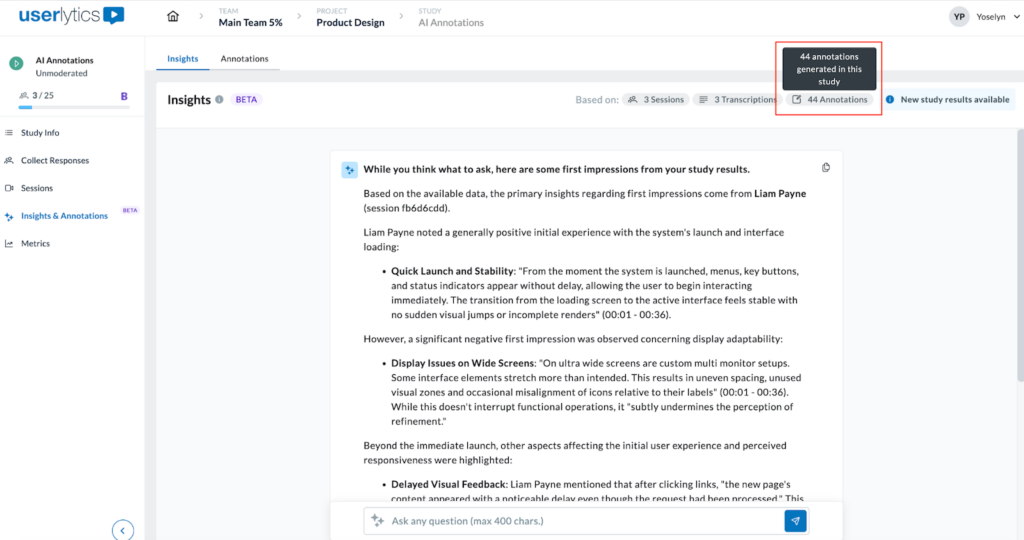
The indicators include:
- Sessions: number of completed sessions by participants.
- Transcriptions: total transcripts generated.
- Annotations: number of annotations created in the study.
These tags are interactive:
- Hovering over each tag displays a tooltip explaining the count (e.g., “44 annotations generated in this study”).
- Values update automatically whenever new data becomes available.
- When new study results are detected, a blue “New study results available” message appears in the header.
- This message is shown when new sessions, transcriptions, or annotations have been added since the last page visit.
- It remains visible until a new insight is generated using the updated data.
Use the toggle at the top of the workspace to move between Insights and Annotations. Click on the Annotations tab.
Now that you’re on the Annotations tab, you’ll be able to visualize all of the annotations the system has automatically generated.
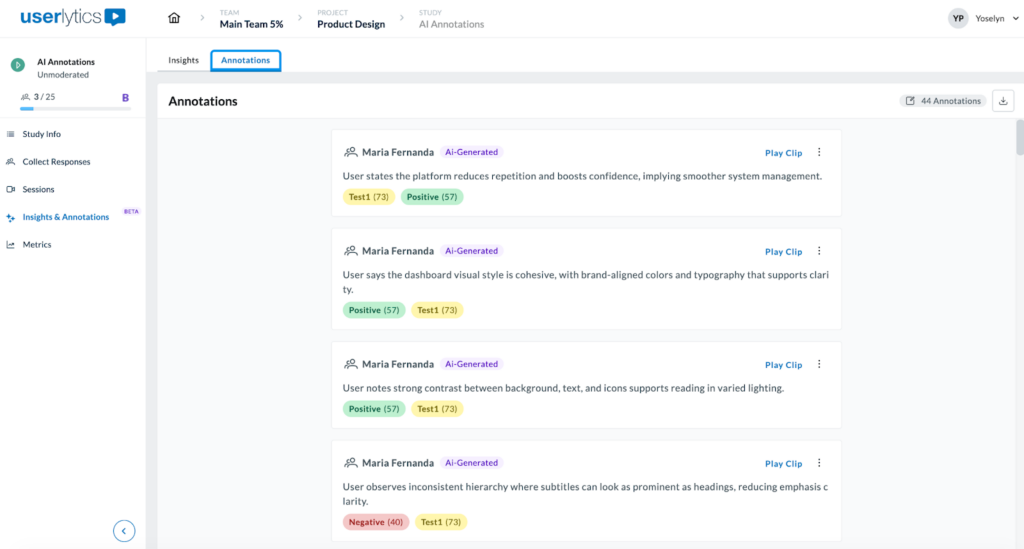
Each entry may include:
- Annotation text or comment.
- Associated tags
- Link to clip
- Copy or export options.
To copy or download the clip, simply click on the three-dot menu next to “Play Clip.”
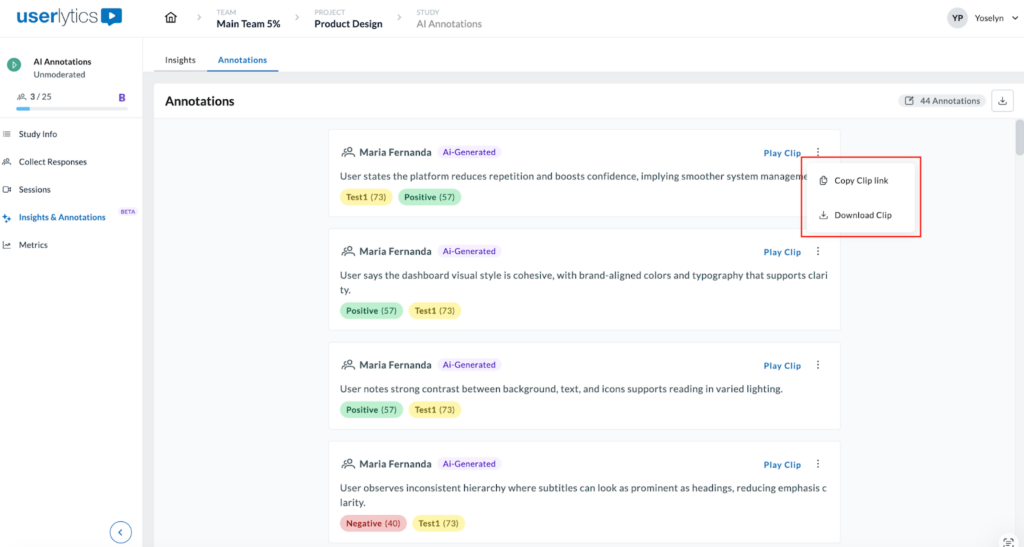
You can also click on the Download (CSV) icon to export all annotations. The exported file will include annotation text, tags, session references, author, and timestamp.
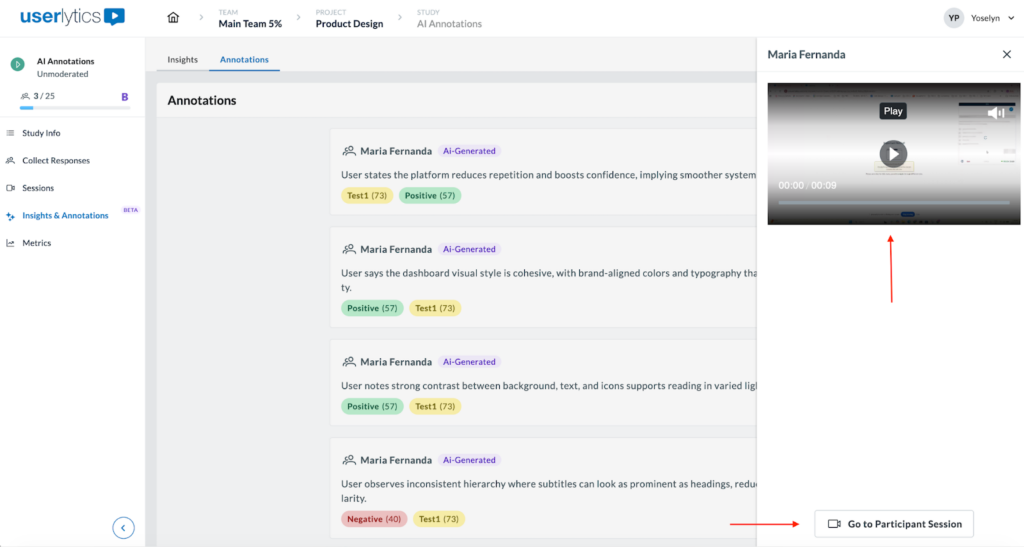
To view the clip where the annotation was taken from, click on the “Play Clip” button.

Once selected, a player opens on the right to show the specific video clip associated with that finding.
You can view the full participant session back by clicking on the video or by clicking on the “Go to Participant Session” button located at the bottom of the sidebar.
In the event that the ‘View Session Highlight’ option is unavailable (as shown below), please ensure you first run the transcription for that session. To do so, click on the “Review full session” button.
Once there, you can “Request Transcription” under the “Session” tab.
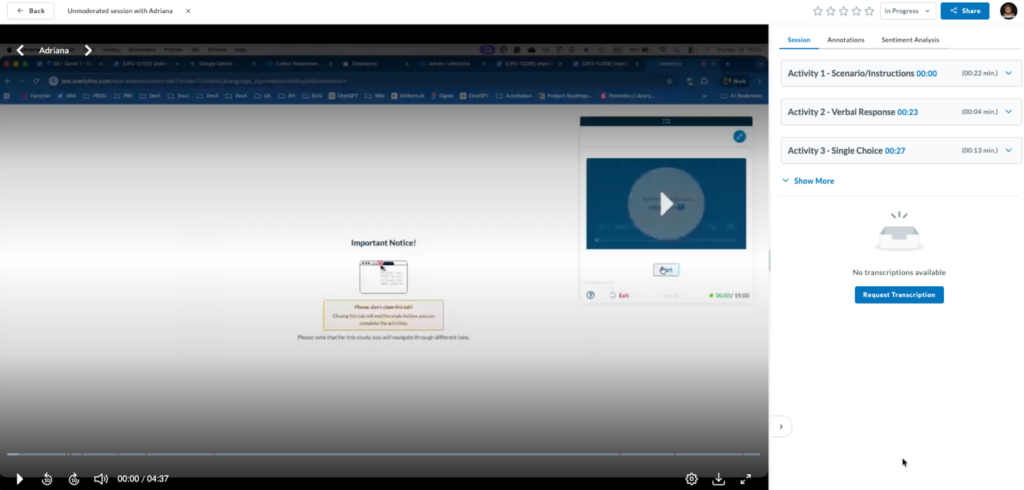
Once the transcriptions are requested, they begin to generate along with the AI annotations, and they are shown in ‘Video Analysis’, in the modal that opens when you click on View Session Highlight, and within Insights & Annotations.