



A redesigned live study workspace pairs with on-demand AI chart summaries, multilingual AI transcript translation, and one-click quantitative reporting to close the gap between collecting user data and acting on it.
MIAMI, FL – August 25, 2026 — Userlytics, a global leader in remote UX research, today formally announces Study Pulse, a redesigned live workspace that gives every study a real-time status view and event timeline. Study Pulse anchors a broader wave of releases rolling out across the platform this year, including on-demand AI Chart Summaries, multilingual AI Transcript Translations, and last week’s launch of Quant Reporting — each aimed at closing the gap between running a study and acting on what it reveals.
The launches continue a rapid release cadence for Userlytics in 2026, following the AI Insights and AI Annotations announced earlier this year, and come as organizations increasingly expect user research to move at the speed of the rest of the product cycle.
“Every release this year builds towards the goal of providing UX and cross-functional teams with tools to improve the quality of their workflows, from the moment a study launches to the moment it turns into a decision. Study Pulse gives that visibility in real time, and the AI capabilities we’ve shipped alongside it, from chart summaries to full transcript translation and now quant reporting, means teams get there faster, without giving up control over the data underneath. This is what an AI-augmented user research platform should feel like: faster and seamless, but with the researcher always at the helm,” affirms Alejandro Rivas Micoud, Userlytics CEO.
Study Pulse: A Live Timeline for Every Study
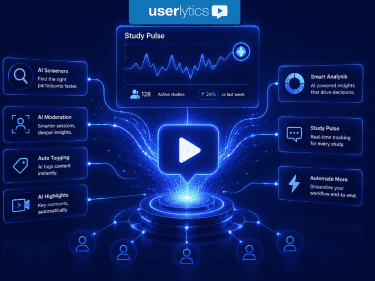
Study Pulse replaces the scattered tabs researchers previously navigated between with a single, live view of every stage of a study. A status header tracks setup, recruitment, and analysis in real time, unlocking analysis as soon as enough participant data has been collected. Below it, a chronological event timeline automatically logs everything happening in the study, from session completions, analysis progress, and more, and surfaces a suggested next step after each milestone, so researchers always know what to do next without hunting for it. Study Pulse is live by default across moderated, unmoderated, and quantitative studies, with no setup required.
“Researchers can lose time just keeping track of where a study stands, with one tab for recruitment, another for sessions, another for results. Study Pulse centralizes all of these stages in one place and nudges the researcher or extended teams on what to do next. It’s unique in the space and we believe it will help teams move the needle forward effortlessly,” shares Mauri Torra, Userlytics’ Product Manager and Study Pulse visionary.
AI Chart Summaries: From Visualization to Interpretation, On Demand
Researchers can now click “Analyze Results” on any supported activity in a study’s Metrics section and get an instant interpretation of what the data means, using logic tailored to that specific activity type rather than a generic summary. Supported activities span Write-In (turning 100+ open-ended responses into 3–5 clear themes), SUS, Card Sorting, Tree Testing, Single/Multi-Choice and Rating questions, and NPS, so the feature reads across both structured metrics and open-ended participant feedback. Results can be copied directly into reports and decks, and refreshed on demand as filters change.
AI Transcript Translations: Research Without Language Barriers
Session transcripts can now be translated directly on the platform, removing friction for researchers who typically had to switch between the platform and other tools to translate user sessions. AI transcript translations are done directly inside the video player, synced to playback, with the click of a button. Userlytics supports 15 languages out of the box (including Spanish, German, French, Arabic, Chinese (Simplified and Traditional), Japanese, and more) with additional languages available on request. Translated transcripts remain fully editable and can be downloaded or reverted to the original at any time, making it easier for global teams to run studies in one language and analyze them in another.
Quant Reporting: From Raw Data to a Full Report in Seconds
Quant Reporting builds directly on AI Chart Summaries: where AI Chart Summaries interpret one activity at a time, Quant Reporting now compiles an entire completed study into a polished, shareable report with a single click from the Metrics tab. Each report pairs a rendered chart with an AI-generated summary of what the data means, so stakeholders get the “why” behind the numbers without manual synthesis. Reports compile asynchronously, so researchers can keep working while it generates, and a completion notification appears directly in the Study Pulse timeline, ready to download and forward. Quant Reporting is designed to sit alongside, not replace, raw data export. The new report format is built for high-level, executive-ready storytelling, while CSV export remains available for analysts doing deeper, custom analysis.
Also Available Now on the Userlytics Platform
These releases follow two earlier 2026 launches that remain live on the platform: BYOU Panel Management, which lets teams import, validate, and send personalized invitations to their own participants (BYOU, or “Bring Your Own Users,” studies) directly from Userlytics; and Participant Waiting List, which lets researchers queue backup participants for moderated BYOU sessions so a no-show never costs a scheduled slot.
Taken together, these 2026 releases to date reflect Userlytics’ continued push to make UX research faster to run, easier to interpret, and accessible to teams beyond dedicated researchers — without sacrificing the traceability back to real participant data that the AI Insights and AI Annotations releases established as a core principle.
Media Contact
Userlytics Inc. Gabriel Rivas-Micoud marketing@userlytics.com.
About Userlytics
Userlytics is a global UX research platform that enables organizations to optimize websites, apps, prototypes, and digital experiences through remote testing and actionable human and AI-based insights. With AI-driven analytics, global participant access, and expert UX consulting services, Userlytics empowers teams to understand user behavior and design with confidence.
Userlytics

Since 2009, Userlytics has helped enterprises, government organizations, nonprofits, agencies, and startups understand their users and optimize their user experiences. Through our UX research platform, global participant panel, and educational resources, we make user research more accessible while sharing insights, expert perspectives, and conversations that help shape the UX community.
Schedule a Free Demo