Tree Testing Clients, Tree Testing Clients, Tree Testing Clients
With Userlytics’ Tree Testing Tool capability, you can improve the information architecture of your websites, apps and digital prototypes. Also known as reverse card sorting or card-based classification, tree testing is an excellent way to evaluate the findability of topics within your digital asset.
What is Tree Testing?
The tree testing task consists of asking the participants to use a hierarchical “map” or “tree” to find a product or theme on a website, mobile app or prototype. This allows you to analyze whether or not the informational structure of your digital asset is intuitive and clear, and if it needs improvement. Card Sorting would logically take place before a tree test; In fact, Tree Testing is a good way to validate the results from your Card Sorting exercises.
How Do I Create a Tree Testing Task in my User Experience Test?
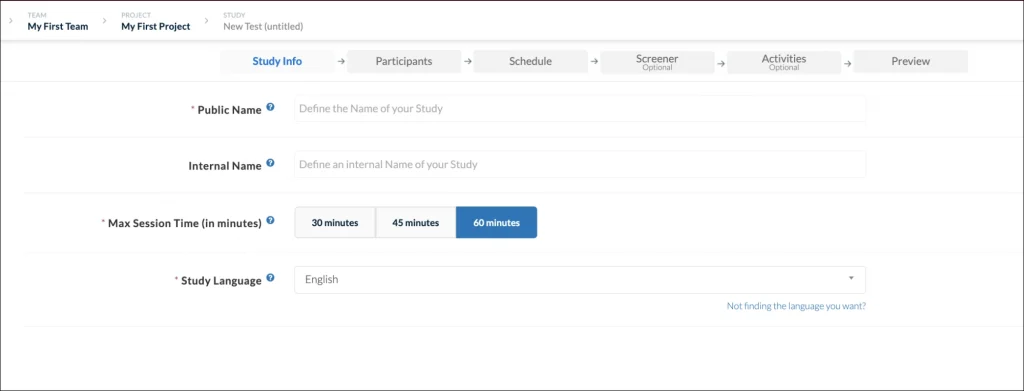
To create a Tree Testing task within your user experience test, go to your Userlytics dashboard. Click on “Create New Test” if you are building out a new test.

Or, if you are adding a task to a user experience test you have already begun building out, click on the study from your dashboard that you would like to add the Tree Testing task to.

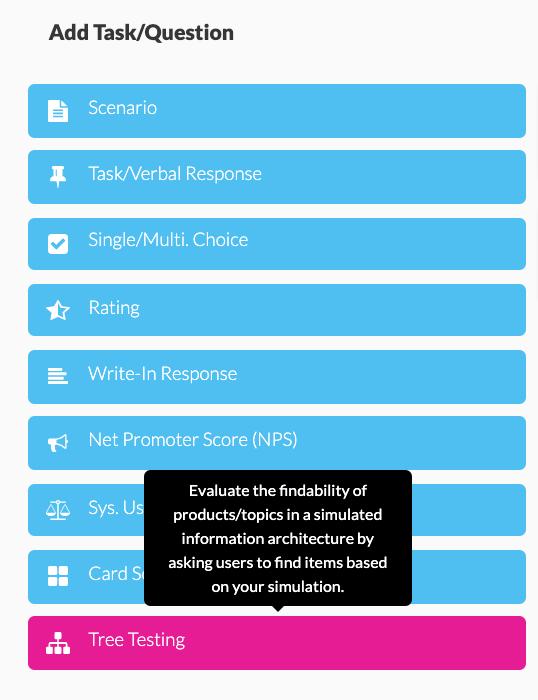
Once you have entered the test builder, select the Activities Tab, and then click “Tree Testing” on the left-hand side of the screen where the test tasks and questions appear.

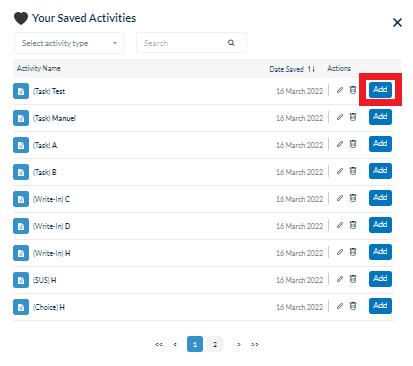
After selecting “Tree Testing” from the task choices, click on the task from within the various tasks and questions on your UX test to begin building it out.

When building out your Tree Testing task, first, you will have to customize the text your testers will see. Here, you will define the product or theme your participants will be sorting into a specific category. Then, you will define your categories, or menu hierarchy. Here, you have the option of defining subcategories to get more and more specific. Your participants will be able to sort through these categories and choose where they believe the product you have specified fits best.

After naming your categories, click the toggle bar on the right-hand side to select the correct response to the task. This will allow you to view the success rate of your Tree Testing task after your participants complete the usability test.

How Do I Interpret Metrics from my Tree Testing Task?
After your participants have completed your user experience test, you can go into your dashboard and view and interpret the results of their Tree Testing task. First, find the “Metrics” option on your Userlytics dashboard. Then, click on the Tree Testing task within your test to view detailed metrics from your participants’ results.

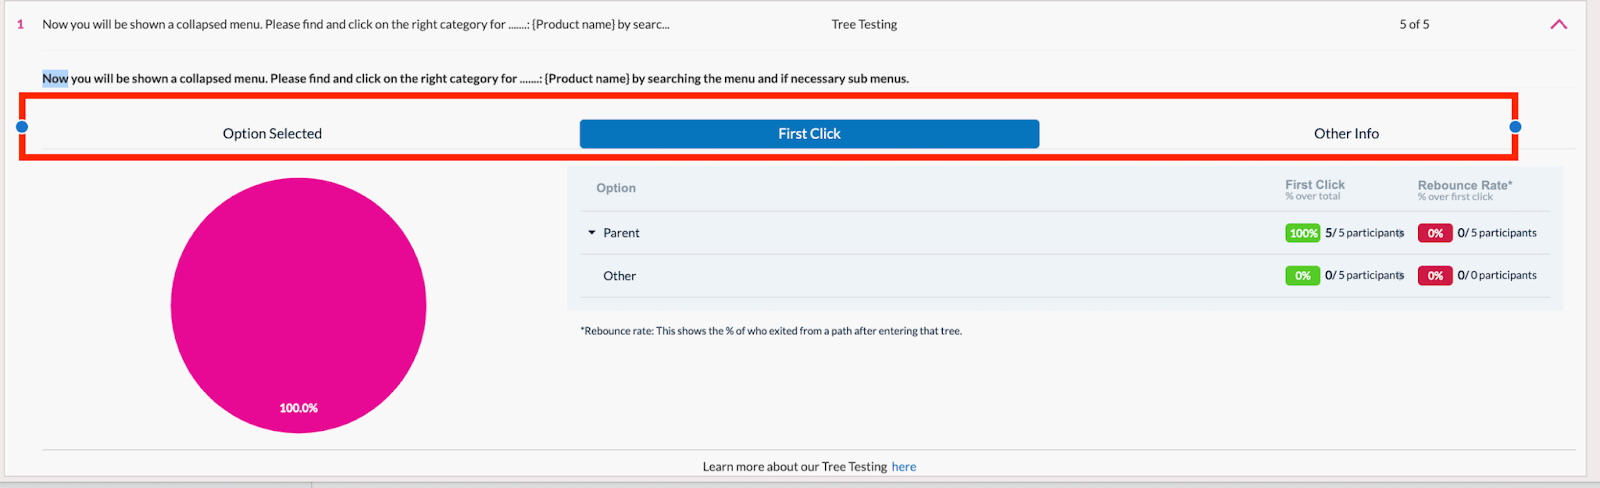
Here, you will be able to see detailed reports that give you suggestions on how you should arrange and organize your digital asset based on your participant results. Under your metrics, there will be three sections: Option Selected, First Click and Other Info.
1) Option Selected
Clicking “Option Selected” on the left-hand side will show you the percent of participants who chose each answer choice to your Tree Testing question.

2) First Click
The middle section, “First Click,” gives you information about whether or not any of your participants clicked on one category option, and then switched it to another option before making a final decision. The pie chart shows the percentage of participants who exited from a path after entering that tree. The information here is helpful because it can indicate whether or not your participants hesitated before selecting a final category, indicating your categories may need some fine-tuning to be more clear and intuitive.

3) Other Info
The third section on the right-hand side, “Other Info” gives you data about the overall results of your Tree Testing task. Information given included the percentage of participants that located the correct path without any backtracking, the number of participants who selected the correct option on the tree, and the average time your participants spent on the task.

Depending on the results of your Tree Testing task, you may receive a red highlighted “WARNING” button. Clicking on the button will warn you if the success rate of your task is lower than the industry average. If so, that means that you may need to consider revising your categories for added clarity.